One of the biggest issues of growing strawberries is, that you may only experience the yield if you are in the last part of the growth. That doesn’t satisfy me. After 100 days of sub-optimal photosynthesis, we talk about quite a lot of growth thus money.
We love to bring that back to 1 day, or if possible even hours.
Below a system for measuring the growth of Runners. In the picture below you see the system.
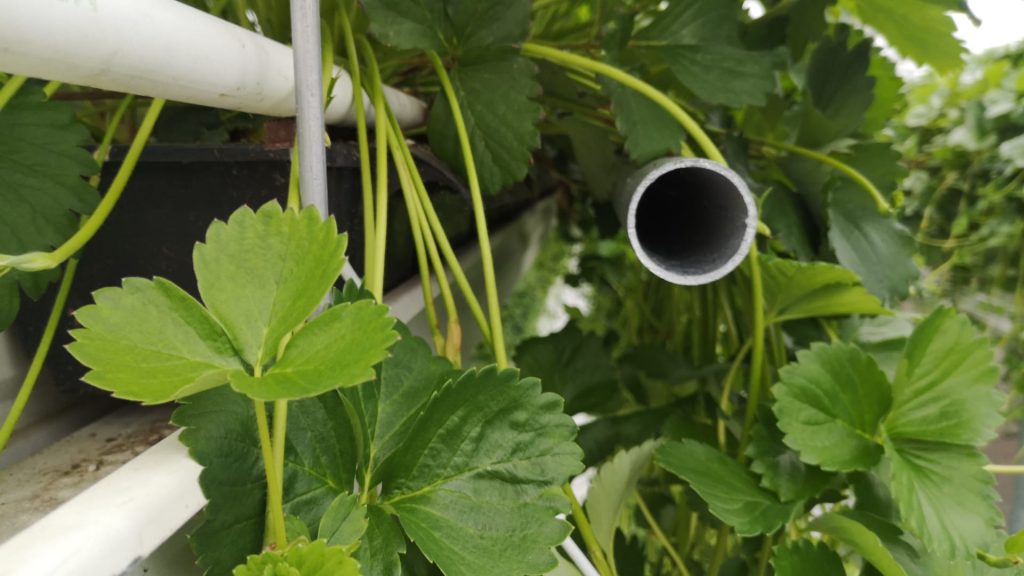
On the left the gutter with container where the strawberry plants are growing. you see the runners from the container growing to the right. The tube there is weighing the runners. This tube is connected with electronic measuring cells.
The results are shown in the graph below:
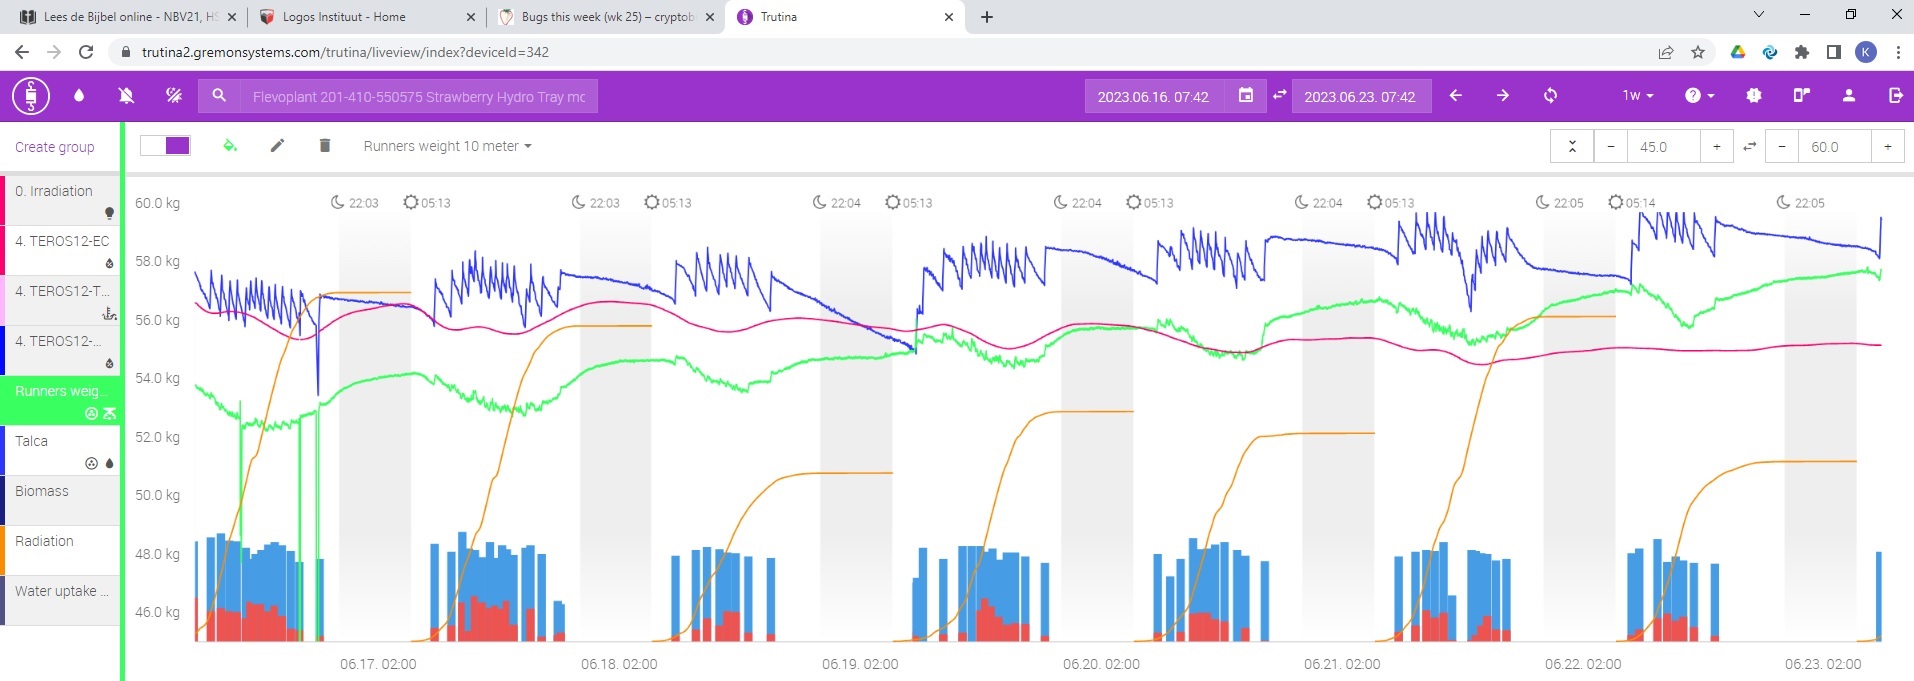
Description:
– left hand ax: weight in kg/10 meter (including pipes etc)
– bottom ax: date
– green line: graph for weight
– reddish: EC
– blue: moisture (scale based)
– yellow: radiation
– Bottom bar graph:
– blue: amount of irrigation (per 2 linear meter)
– red: amount of drain
Results
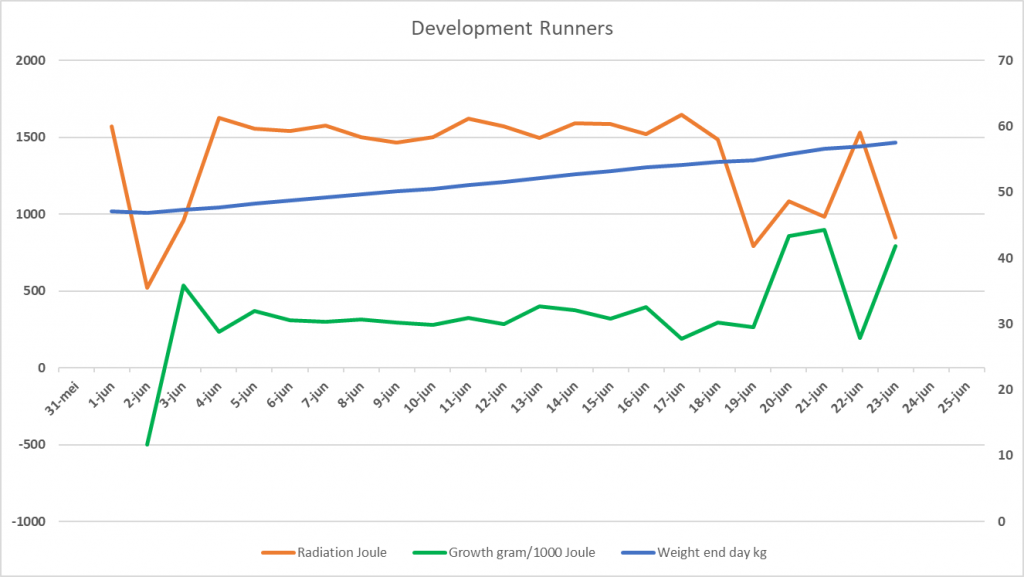
In the graph above you see the first results:
– Left ax: Radiation in joule and growth (gram/1000 joule)
– Right ax: Weight just before sunrise
-Lines:
– Orange: Radiation (Joule/day)
– Green: Growth in gram/10 meter/1000 Joule
– Blue: Weight just before sunrise
Interesting to see is the differences from day to day. Just these are the reason for measuring: why are the differences there and how can we use them for optimizing the growth and thus the results.